By Chelsea Scott
Scientists can use multi-temporal lidar data to examine how trees change over time, for example, due to wildfire, disease, altered environmental conditions, or in response to forest management activities. Multi-temporal lidar refers to two or more lidar datasets collected at different times that show how forests change over time.
However, when examining such change, it is important to ensure that differences in data acquisition and seasonality are not mistaken for actual changes to trees. For instance, lidar point cloud density often increases over time, and this higher point density allows for more detailed measurements of tree characteristics. In deciduous trees especially, seasonal differences exist between leaf-on, leaf-off, and intermediate states.
Here, we examine differences in height and crown area for three trees in New York City, recorded by lidar datasets collected in 2014 and 2017. This intentionally small focus area allows us to analyze changes in tree geometry and data characteristics in detail. We conduct this analysis using LidR software (Roussel et al., 2020).

The three trees in the foreground are the focus of this analysis. This is showing Martyrs’ Court located at Fordham University in the Bronx, New York City. The image is a Google Street View capture.
We analyze two lidar point cloud datasets: The first was collected in 2013-2014 in response to Hurricane Sandy and spans the five boroughs of New York City. The dataset has an average point density of almost 5 points/m2 and includes a 1 m bare-earth raster product. The portion covering the trees of interest was collected in May and August 2014.
The second dataset, collected in May-July 2017, also spans the five boroughs. The topographic lidar (land-based) was collected in May 2017 with 50% leaf-off conditions and point density of 23 points/m2.
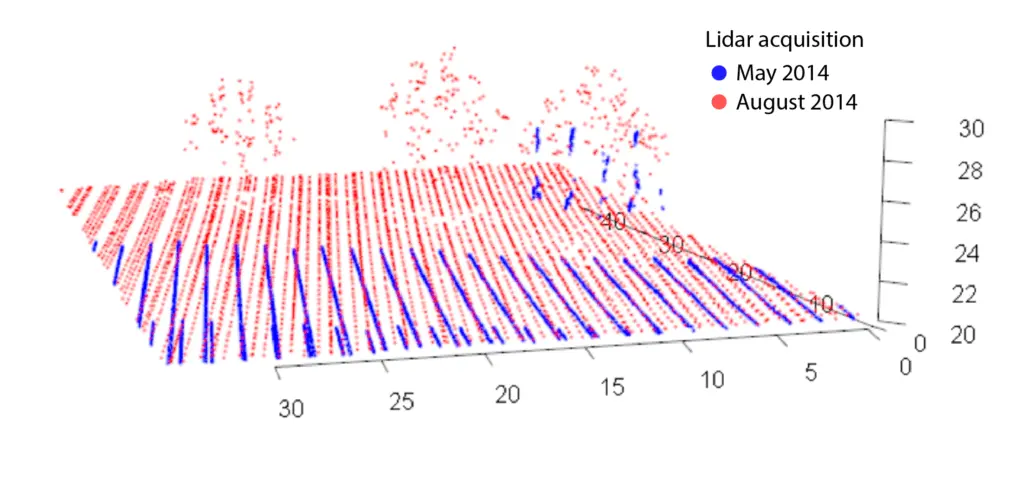
Lidar point cloud from NOAA’s 2014 post-Hurricane Sandy collection. Colors indicate acquisition date: Blue indicates a May 2014 acquisition, and red for August 2014. Larger datasets are often collected over extended time periods, and this example illustrates that even in a small area, a single dataset can represent different seasons. Note also the diner point spacing along individual scan lines compared to adjacent lines. Gridding datasets with this acquisition geometry at too fine a spatial resolution can introduce striping artifacts.

Lidar-derived topographic hillshades show the three trees. Left: 2014 lidar data with a 5 points/m2– point density gridded to a 1-m resolution. Right: 2017 lidar data with a 23 points/m2 point density gridded to a 25-cm resolution. The blue lines trace the cross-section location shown below.
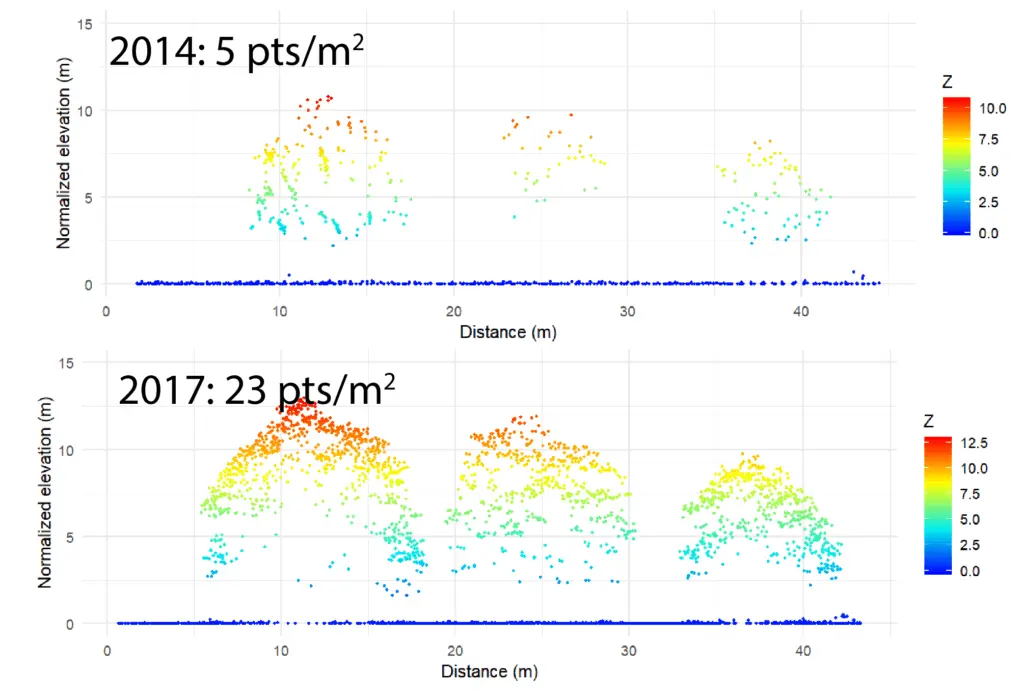
Cross-sections of normalized elevation through the three trees, colored by normalized elevation. Top: 2014 lidar, Bottom: 2017 lidar. The higher point cloud density in 2017 captures more detail of the tree geometry.
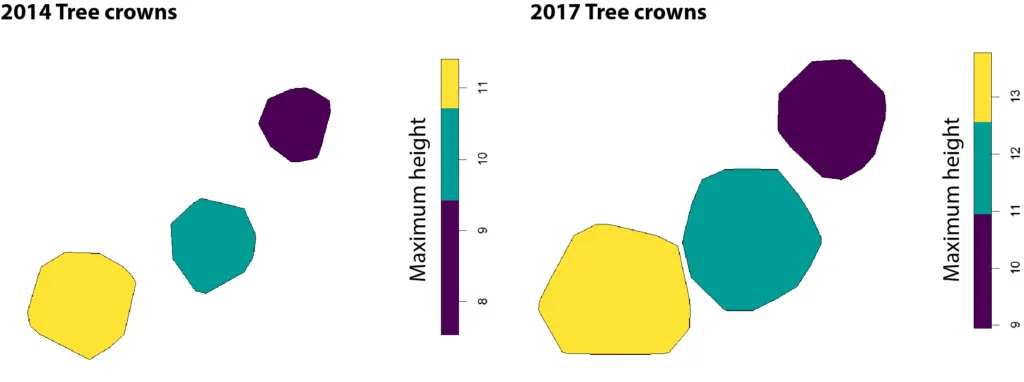
Map of tree crowns colored by tree height for 2014 and 2017. This plot illustrates changes in crown area and tree height over time. The tree crown encompasses the tree’s branches and leaves.
The figures above indicate an increase in the point cloud’s density, tree crown area and tree height between August 2014 and May 2017, indicating net tree growth during that nearly three-year period. Most of the 2014 data were acquired in August, during leaf-on conditions. The 2017 data were acquired in May when leaves are growing. The datasets would be more directly comparable if both were acquired at the same time of year. It is likely that the 2017 data would show even taller trees and larger crown areas if collected in August.
References:
Roussel, J.-R., Auty, D., Coops, N. C., Tompalski, P., Goodbody, T. R. H., Meador, A. S., et al. (2020). lidR: An R package for analysis of Airborne Laser Scanning (ALS) data. Remote Sensing of Environment, 251, 112061. https://doi.org/10.1016/j.rse.2020.112061
NOAA (2017). 2017 NYC Topobathy Lidar: New York . https://portal.opentopography.org/noaaDataset?noaaID=9306
U.S. Geological Survey (2021). NYC New York City . Distributed by OpenTopography. https://portal.opentopography.org/usgsDataset?dsid=NY_NewYorkCity