This article describes how to interpret the data products (layers) in the Kaibab Forest Wildfire Impact Map, illustrated with an example from the area affected by the Willis Fire, which ignited on July 13, 1987 and burned approximately 7 km² in northern Arizona. Our study area lies near the fire’s boundary, where changes in vegetation structure due to the wildfire are clearly visible. The lidar dataset used here was collected in 2012, 25 years after the wildfire at a point density of 15 points/m². By that time, some forest recovery had likely occurred, yet the lidar still reveals a sharp contrast in tree density across the fire perimeter.
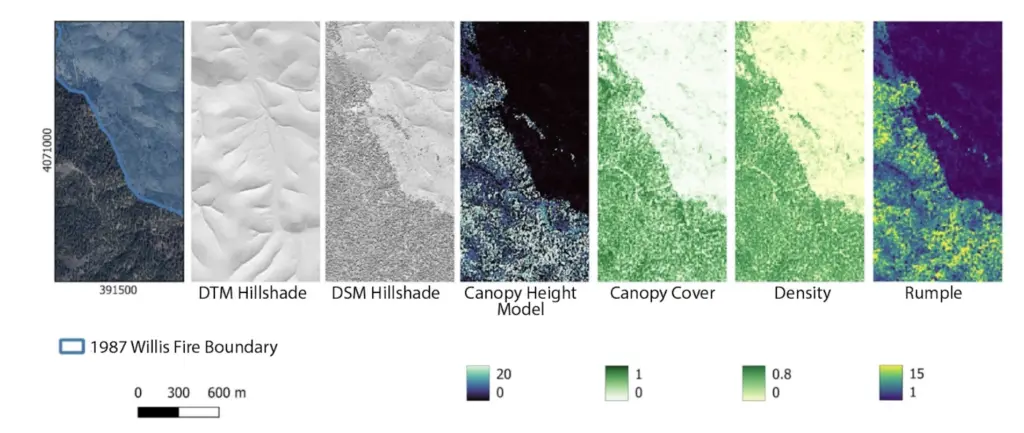
Digital Terrain Model: A digital terrain model (DTM) is a 1-m resolution grid representing the bare-earth surface, with vegetation, buildings and other above-ground features removed. In this area, the DTM shows a gently hilly landscape dissected by small stream channels.
Digital Surface Model: A digital surface model (DSM) is a grid of elevations representing the top of the landscape and is typically produced from the first lidar returns. In this area, the DSM shows a distinct contrast in vegetation cover that closely follows the Willis fire boundary: There is dense vegetation outside of the burn area, while the burned area shows a more open canopy with scattered trees.
Canopy Height Model: The canopy height model (CHM), calculated at a 1-m resolution, measures the height of vegetation above the ground surface. In this area, the CHM highlights a change in vegetation across the Willis Fire boundary. Many trees outside of the burned area reach a height of 30 meters, while trees within the burned areas are smaller, often 6 m tall.
Canopy Cover: The 10-m resolution canopy cover describes the proportion of the ground surface covered by tree crowns, providing a measure of forest structure, canopy openness, and light availability at the ground surface. Across the Willis Fire boundary, canopy cover drops, indicating more open conditions and increased solar radiation within the burned area.
Density: The 10-m resolution density is calculated from the normalized full point cloud dataset and represents the percentage of lidar returns located at least 2 m above the ground surface. This measures the amount of vertical vegetation structure present. Across the Willis Fire boundary, the point density above 2-m drops from 0.7 outside of the burned area to 0.1 inside, reflecting the substantial loss of biomass during the wildfire and the limited regrowth in the following years.
Rumple: Rumple is the ratio of the canopy surface area to the ground surface area and measures canopy complexity, often correlating with forest age, establishment patterns, local disturbances, and stand management. In the Willis Fire area, rumple displays a clear change across the fire boundary. Rumple also varies with topography outside of the fire boundary, where rumple is lower along south-facing slopes and higher along riparian zones surrounding the streams where the vegetation is denser and more structurally complex.
References:
Mapping the Kaibab Plateau, AZ. (2012) Distributed by OpenTopography. https://doi.org/10.5069/G9TX3CH3.
Krishnamari, S., Scott, C. (2025) Multi-Temporal Lidar Workflow for Forest Change Mapping. https://github.com/OpenForest4D/multi-temporal-lidar-forestry
Scott, C., Krishnamari, S., Phan, M., Nandigam, V., (2025) Kaibab Forest Wildfire Impact Map. https://of4d.sdsc.edu/usecases/kaibab_forest_lidar