Multi-temporal lidar refers to two or more lidar datasets collected over the same area at different points in time. Comparing these datasets allows scientists to measure how forests and the bare-earth terrain change in response to wildfires and other natural hazards. Such analyses reveal trees lost to fire, quantify reductions in canopy cover, and detect debris flows that can threaten critical infrastructure.
In this article, we examine how the Cat wildfire in the Kaibab National Forest of northern Arizona altered the landscape, using both airborne lidar and satellite imagery data. The Cat Fire ignited on August 6, 2018 and burned 4,578 acres (18.5 km2) north of the Grand Canyon. For this analysis, we compare pre-fire lidar collected in 2012 at 15 points/m2 with post-fire lidar collected in 2019 at 17 points/m2.
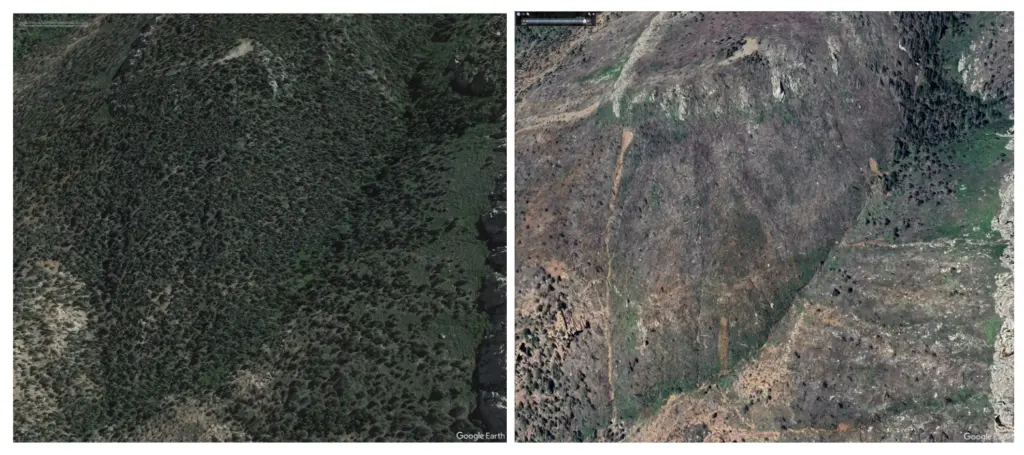
Satellite imagery shown below provides an overview of the area, showing a canyon bordered by ponderosa pine forests along both hillslopes. Most of this vegetation was burned in the wildfire, except for a small patch in the upper-right portion of the scene.
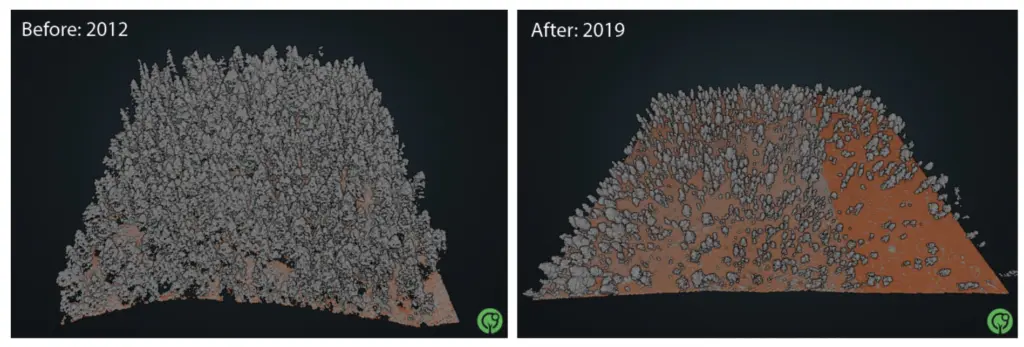
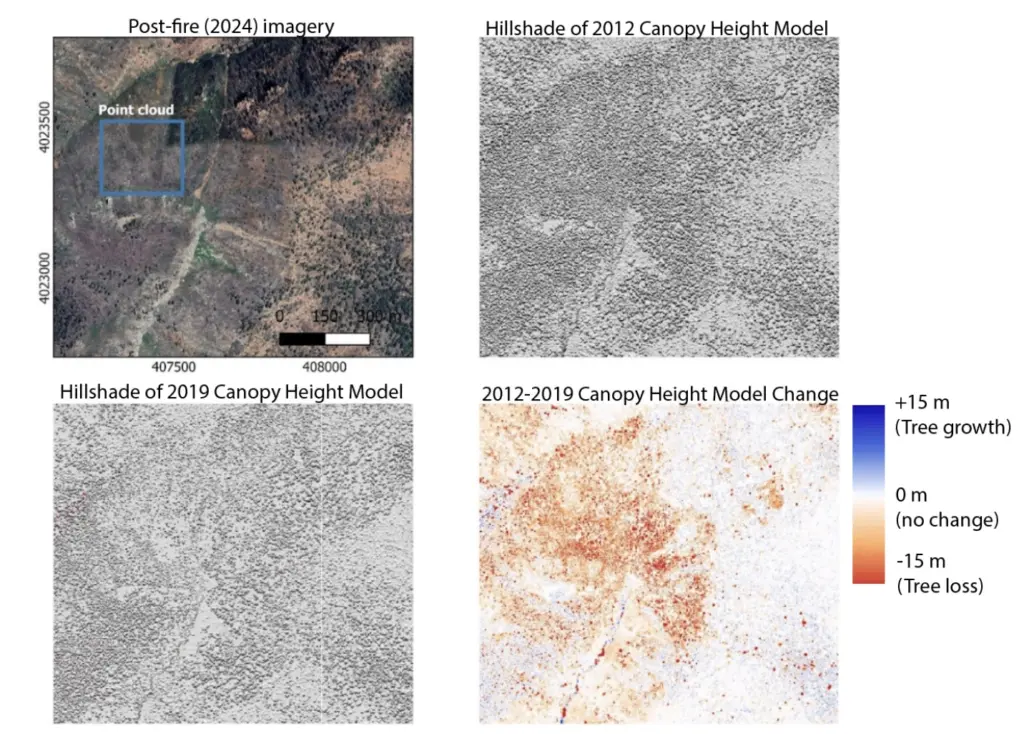
The pre-fire lidar point cloud captures the detailed structure and density of the ponderosa pine forest, while the post-fire lidar reveals that many trees were completely lost or substantially reduced in height. A canopy height model (CHM) measures the height of vegetation above the ground surface. By comparing CHM’s before and after the wildfire, we can both visualize and quantify vegetation loss. These change maps highlight pronounced canopy reductions. Particularly near the center of the study area shown in the last figure, the orange to red colors represent a decrease in tree height or the loss of complete trees.
References:
Mapping the Kaibab Plateau, AZ. (2012) Distributed by OpenTopography. https://doi.org/10.5069/G9TX3CH3.
U.S. Geological Survey (2021). AZ NorthKaibabNF B1 2019. Distributed by OpenTopography. https://portal.opentopography.org/usgsDataset?dsid=AZ_NorthKaibabNF_B1_2019.
Krishnamari, S., Scott, C. (2025) Multi-Temporal Lidar Workflow for Forest Change Mapping. https://github.com/OpenForest4D/multi-temporal-lidar-forestry
Scott, C., Krishnamari, S., Phan, M., Nandigam, V., (2025) Kaibab Forest Wildfire Impact Map. https://of4d.sdsc.edu/usecases/kaibab_forest_lidar