By Sreeja Krishnamari & Chelsea Scott
Regional-scale maps of forest characteristics—such as canopy height, canopy cover, and their changes over time—are essential for assessing wildfire impacts on landscapes, ecosystems, and potential cascading hazards like debris flows. Yet, producing these metrics is challenging, requiring advanced geospatial skills to reconcile datasets with varying characteristics (e.g., coordinate reference systems, point cloud densities), substantial computing power, and multiple software packages in different programming languages. To address these barriers, we developed a workflow that generates multiple lidar-derived forest metrics and their temporal changes, streamlining the process and making the analysis more accessible.
This repository contains R and Jupyter workflows for retrieving, processing, and analyzing multi-temporal large lidar datasets to measure forest characteristics and detect changes over time. The workflow produces digital terrain models (DTMs), digital surface models (DSMs), canopy height models (CHMs), canopy cover, point cloud density above 2-m and rumple index. Each step is standardized in Jupyter notebooks and R scripts to ensure the workflow is reproducible, scalable, and easily adaptable for applying these calculations to new regions using both modern and legacy lidar datasets.
The workflow supports:
- Data retrieval from the USGS 3D Elevation Project and OpenTopography
- Lidar point cloud coordinate reference system projection and tiling
- Grid/raster-based forest metrics calculation of digital terrain models (DTMs), digital surface models (DSMs), canopy height models (CHMs), canopy cover, point cloud density above 2-m and rumple index) using lidR (Roussel et al., 2020)
- Differencing of the multi-temporal grid/raster-based forest metrics to measure changes to forest geometry over time using
- Topographic hillshades and change visualizations via QGIS
Github repository: https://github.com/OpenForest4D/multi-temporal-lidar-forestry
Below, we show an illustration of the workflow and the application of the workflow to lidar datasets spanning the Kaibab National Forest in Northern Arizona.
Illustration of the multi-temporal lidar workflow, including data access and initial processing steps (tiling and coordinate reference system projection), wall-to-wall processing with lidR to generate gridded derivatives of the forest geometry, change analysis of all gridded products, and data visualization.
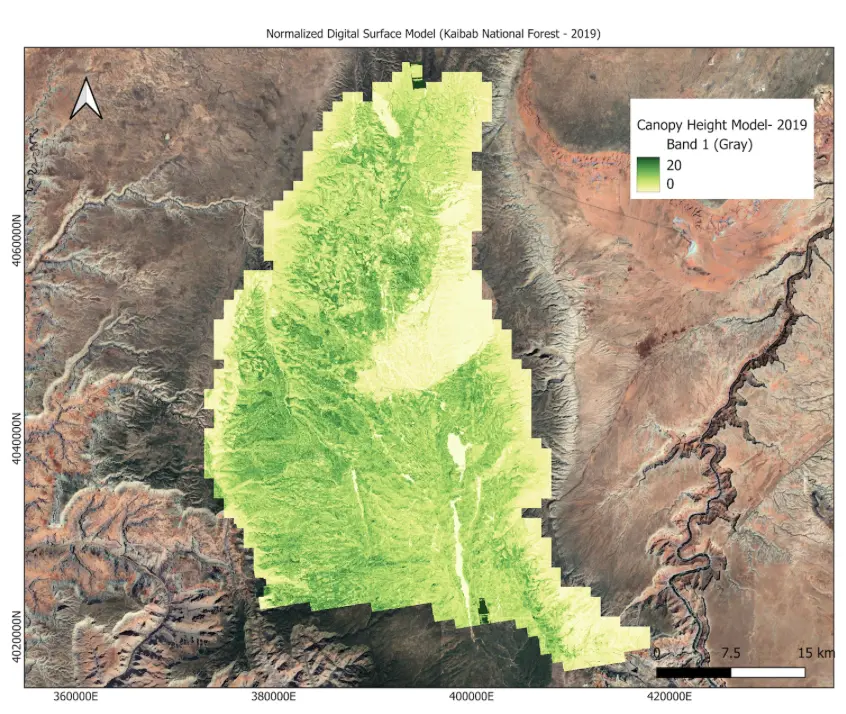
Canopy Height Model calculated from summer 2019 lidar collected through the USGS 3D Elevation Program at the Kaibab National Forest in Northern Arizona just north of the Grand Canyon (AZ NorthKaibabNF B1 2019).
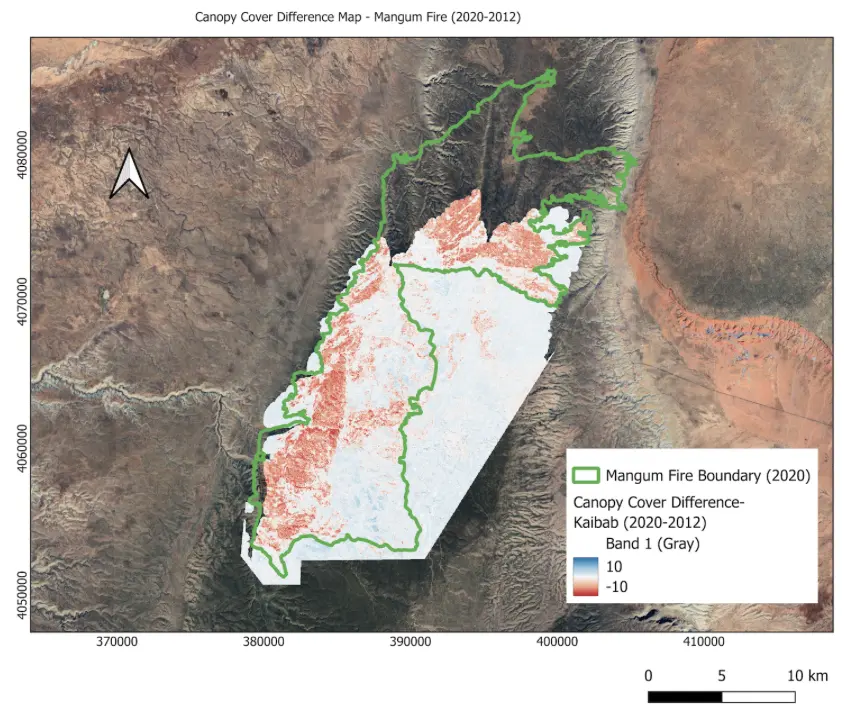
Change in Canopy cover between 2012 and 2020 derived from lidar. Negative values (red) indicate canopy loss, zero (white) shows no change, and positive values (blue) represent canopy gain. The green outline (MTBS) traces the boundary of the Magnum fire, a wildfire which began on June 8, 2020. Red within the fire perimeter highlights vegetation loss caused by the fire.
References:
Monitoring Trends in Burn Severity: https://www.mtbs.gov
OpenTopography (2020). Mapping the Kaibab Plateau AZ. https://portal.opentopography.org/datasetMetadata?otCollectionID=OT.082019.26912.1
Roussel, J.-R., Auty, D., Coops, N. C., Tompalski, P., Goodbody, T. R. H., Meador, A. S., et al. (2020). lidR: An R package for analysis of Airborne Laser Scanning (ALS) data. Remote Sensing of Environment, 251, 112061. https://doi.org/10.1016/j.rse.2020.112061
U.S. Geological Survey (2020). AZ Coconino B1 2019. Distributed by OpenTopography. https://portal.opentopography.org/usgsDataset?dsid=AZ_Coconino_B1_2019
2020 lidar data: US Forest Service.