Regional-scale maps of forest characteristics—such as canopy height, canopy cover, and their changes over time derived from lidar—are essential for assessing wildfire impacts on landscapes, ecosystems, and cascading hazards like debris flows. Researchers apply these products to monitor canopy height reductions and ecosystem recovery in fire-affected areas such as the Kaibab Plateau, supporting biodiversity conservation, hazard risk mapping (including post-fire debris flows), and forest carbon stock estimation by quantifying above-ground biomass changes over time.
We created an interactive map as part of a study examining forest characteristics across a portion of the Kaibab Plateau in northern Arizona. Using airborne lidar data collected in 2012, 2019, 2020, and 2021, the map allows users to explore spatial patterns in forest structure and observe how these metrics have changed over time in response to recent wildfires.
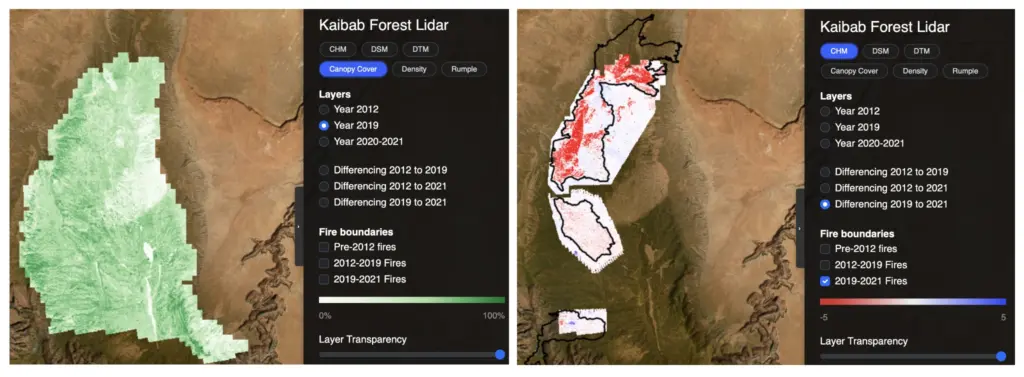
The information below summarizes the airborne lidar datasets used in the study, the data layers represented in the interactive map as well as the boundaries of the forest fires from 1982–2021.
Source Airborne Lidar Datasets:
2012: USFS Mapping the Kaibab Plateau, AZ– This airborne lidar dataset was collected in August–September 2012 by the U.S. Forest Service and has 15 pts/m2. (https://doi.org/10.5069/G9TX3CH3)
2019: USGS Arizona North Kaibab National Forest 2019 – This airborne lidar dataset was collected in June–July 2019 as part of the U.S. Geological Survey’s 3D elevation program and has 17 pts/m2. (Dataset Metadata; dataset also available via OpenTopography).
2020-2021: This airborne lidar dataset was collected in September and October, 2020 for the Castle and Ikes fires and June 2021 for the Magnum fire by the U.S. Forest Service. The dataset has 20–28 pts/m2.
Map Products:
Digital Terrain Model (DTM): The DTM is a 1-m resolution grid of bare-earth elevation with vegetation and buildings removed.
Digital Surface Model (DSM): The DSM is a 1-m resolution grid of elevations of the landscape top and is typically made from the first lidar returns.
Canopy Height Model (CHM): The CHM, calculated at a 1-m resolution, measures the height of vegetation above the ground surface.
Canopy cover: The canopy cover, calculated at a 10-m resolution, indicates the proportion of the ground surface that is covered by tree crowns and is a measure of forest structure, canopy openness, and light availability at the ground surface.
Density: The 10-m resolution density is calculated from the normalized full lidar point cloud and is the percentage of lidar returns at least 2 m above the ground surface.
Rumple: Rumple is the ratio of the canopy surface area to the ground surface area, calculated at 10-m resolution. This measures canopy complexity and often correlates with forest age, establishment patterns, local disturbances, and stand management.
Wildfire Extent Mapping (Fire Boundaries):
The Monitoring Trends in Burn Severity (MTBS) is an interagency program that has mapped the extent of large fires across the U.S. since 1982.
Data Processing Workflow:
More information and details on how the data was processed can be found here – Multi-Temporal Lidar Workflow for Forest Change Mapping.
Citation
Chelsea P Scott, Sreeja Krishnamari, Minh Phan, Viswanath Nandigam (2025): Kaibab Forest Wildfire Impact Map. OpenForest4D. InteractiveResource. https://doi.org/10.5069/G91C1V33